VS Code Extension
Overview
The Inspect VS Code Extension provides a variety of tools, including:
- Integrated browsing and viewing of eval log files
- Commands and key-bindings for running and debugging tasks
- A configuration panel that edits config in workspace
.envfiles - A panel for browsing all tasks contained in the workspace
- A task panel for setting task CLI options and task arguments
Installation
To install, search for “Inspect AI” in the extensions marketplace panel within VS Code.

The Inspect extension will automatically bind to the Python interpreter associated with the current workspace, so you should be sure that the inspect-ai package is installed within that environment. Use the Python: Select Interpreter command to associate a version of Python with your workspace.
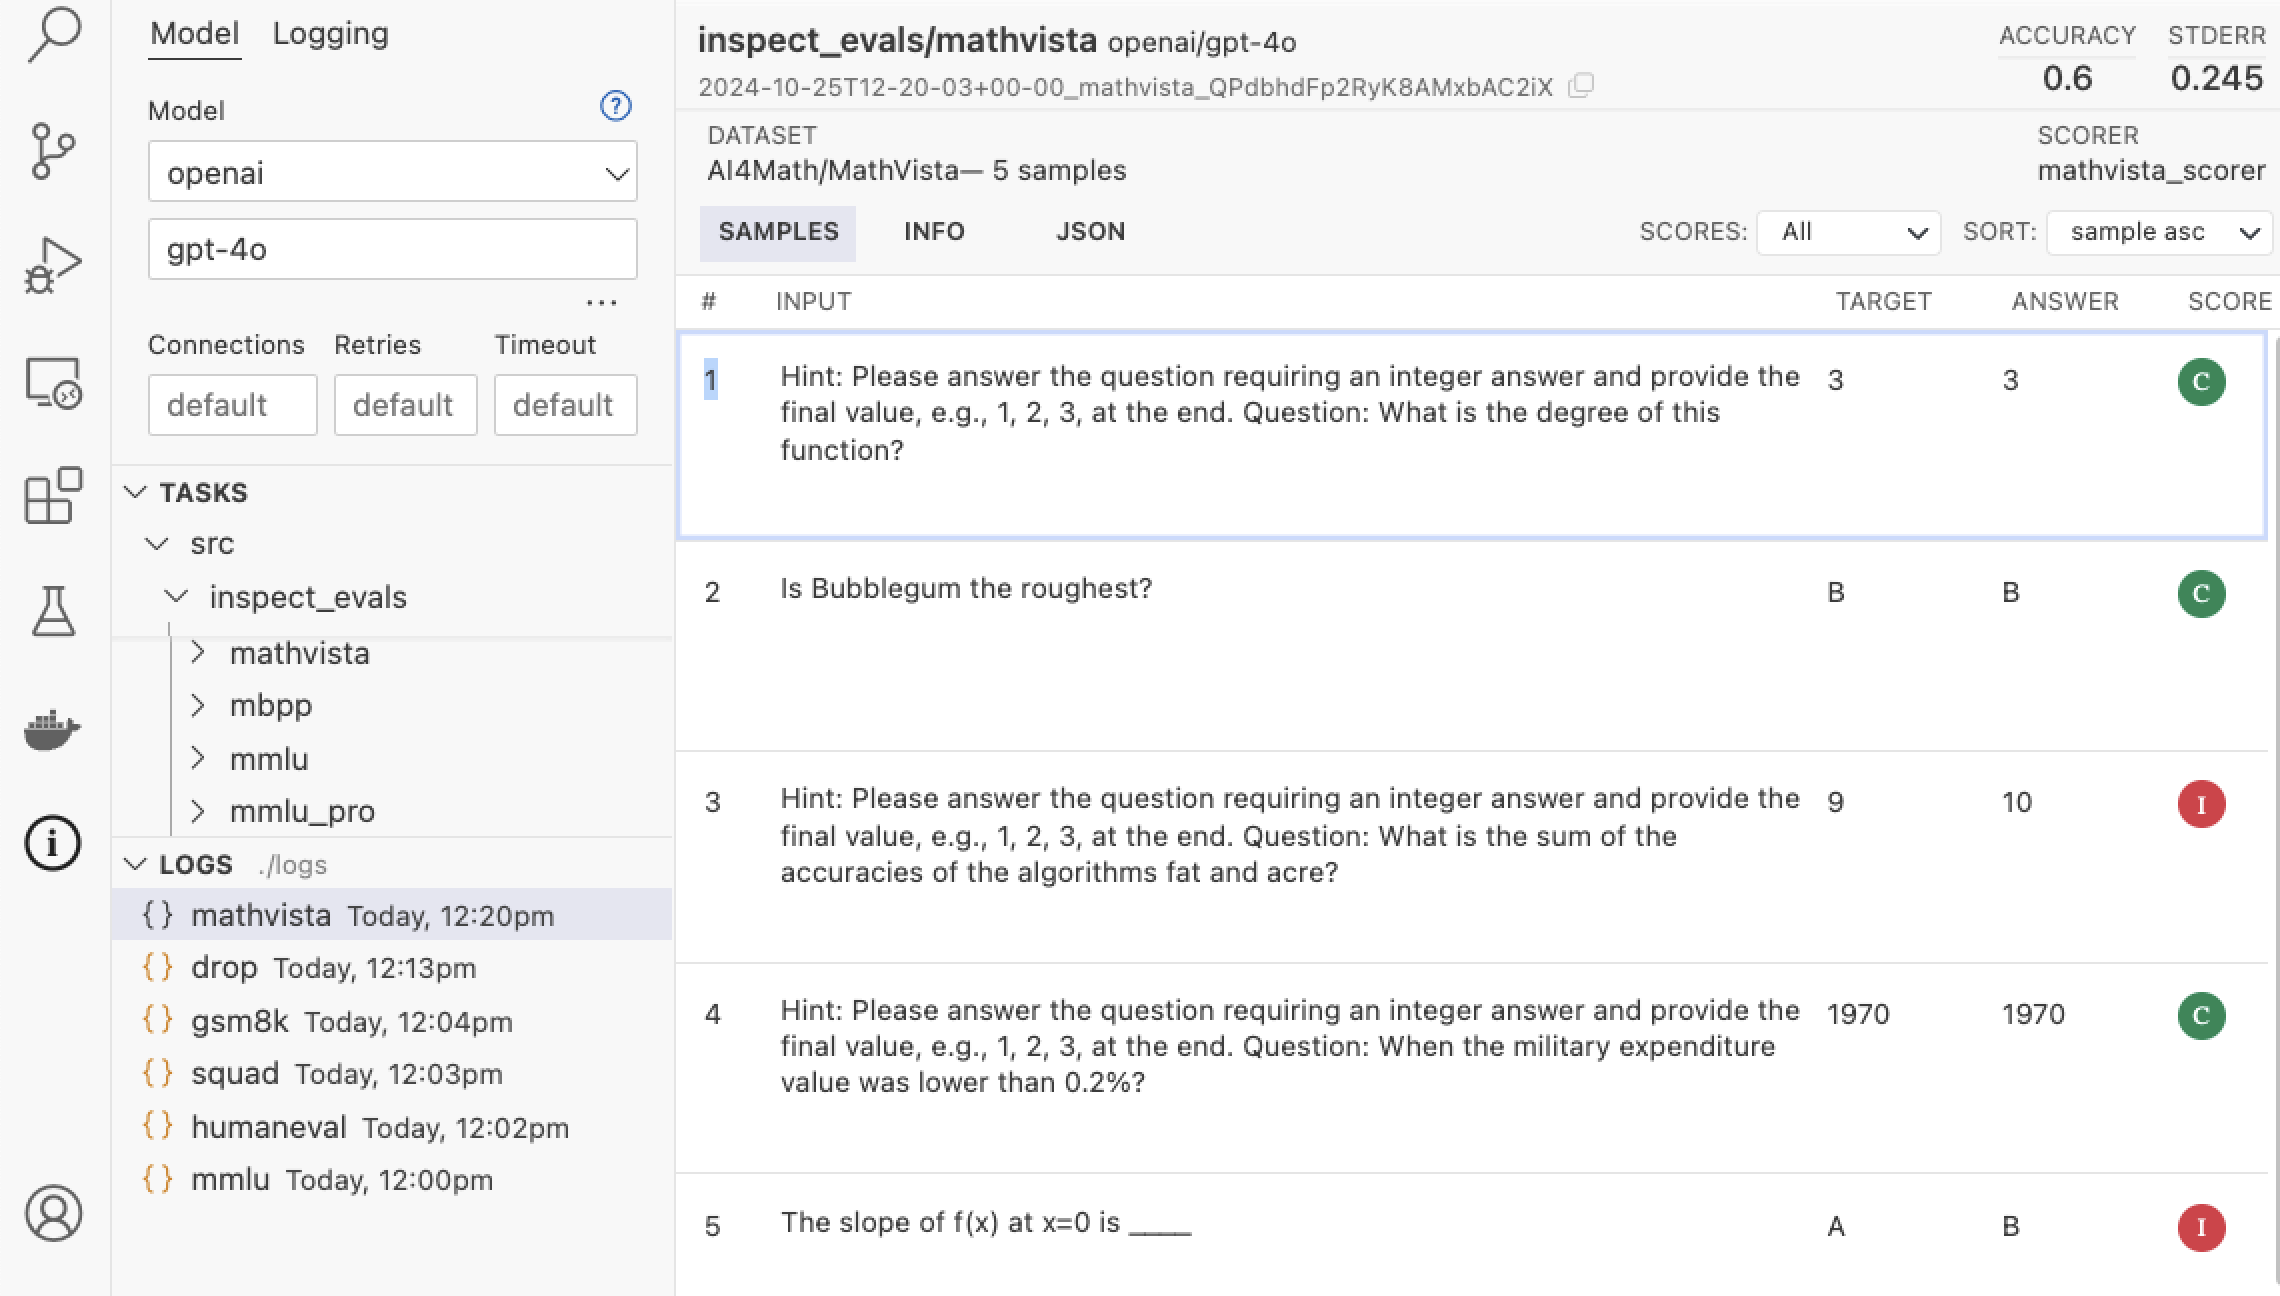
Viewing Logs
The Logs pane of the Inspect Activity Bar (displayed below at bottom left of the IDE) provides a listing of log files. When you select a log it is displayed in an editor pane using the Inspect log viewer:
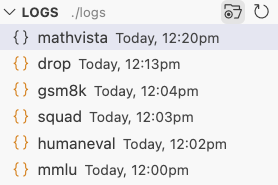
Click the open folder button at the top of the logs pane to browse any directory, local or remote (e.g. for logs on Amazon S3):
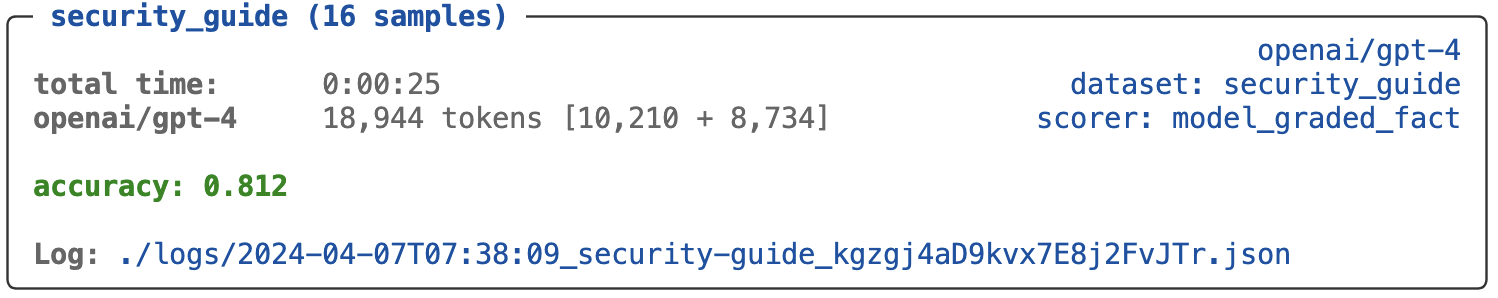
Links to evaluation logs are also displayed at the bottom of every task result:
If you prefer not to browse and view logs using the logs pane, you can also use the Inspect: Inspect View… command to open up a new pane running inspect view. See the article on the Log Viewer for additional details on using it to explore eval results.
Run and Debug
There are several ways to run tasks within VS Code:
inspect evalin the terminal- Calling eval() in a script
- Using the Run Task button .
- Using the Cmd+Shift+U keyboard shortcut.
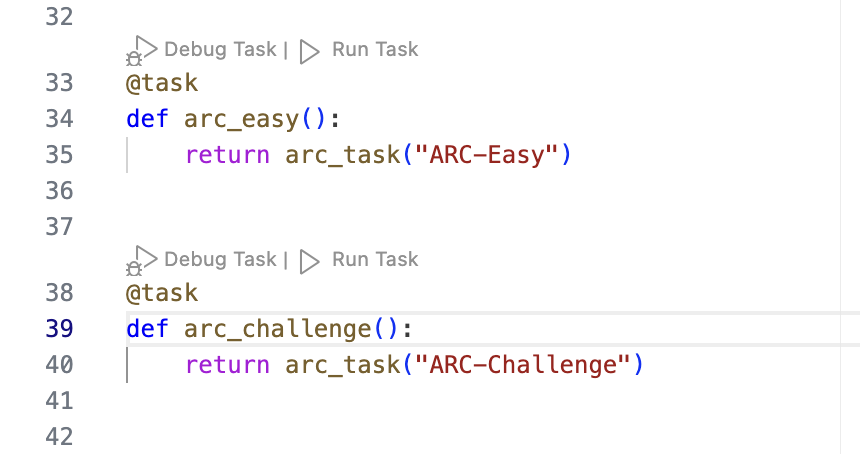
You can also run tasks in the VS Code debugger by using the Debug Task button or the Cmd+Shift+T keyboard shortcut.
Note that when debugging a task, the Inspect extension will automatically limit the eval to a single sample (--limit 1 on the command line). If you prefer to debug with many samples, there is a setting that can disable the default behavior (search settings for “inspect debug”).
Activity Bar
In addition to log listings, the Inspect Activity Bar provides interfaces for browsing tasks tuning configuration. Access the Activity Bar by clicking the Inspect icon on the left side of the VS Code workspace:
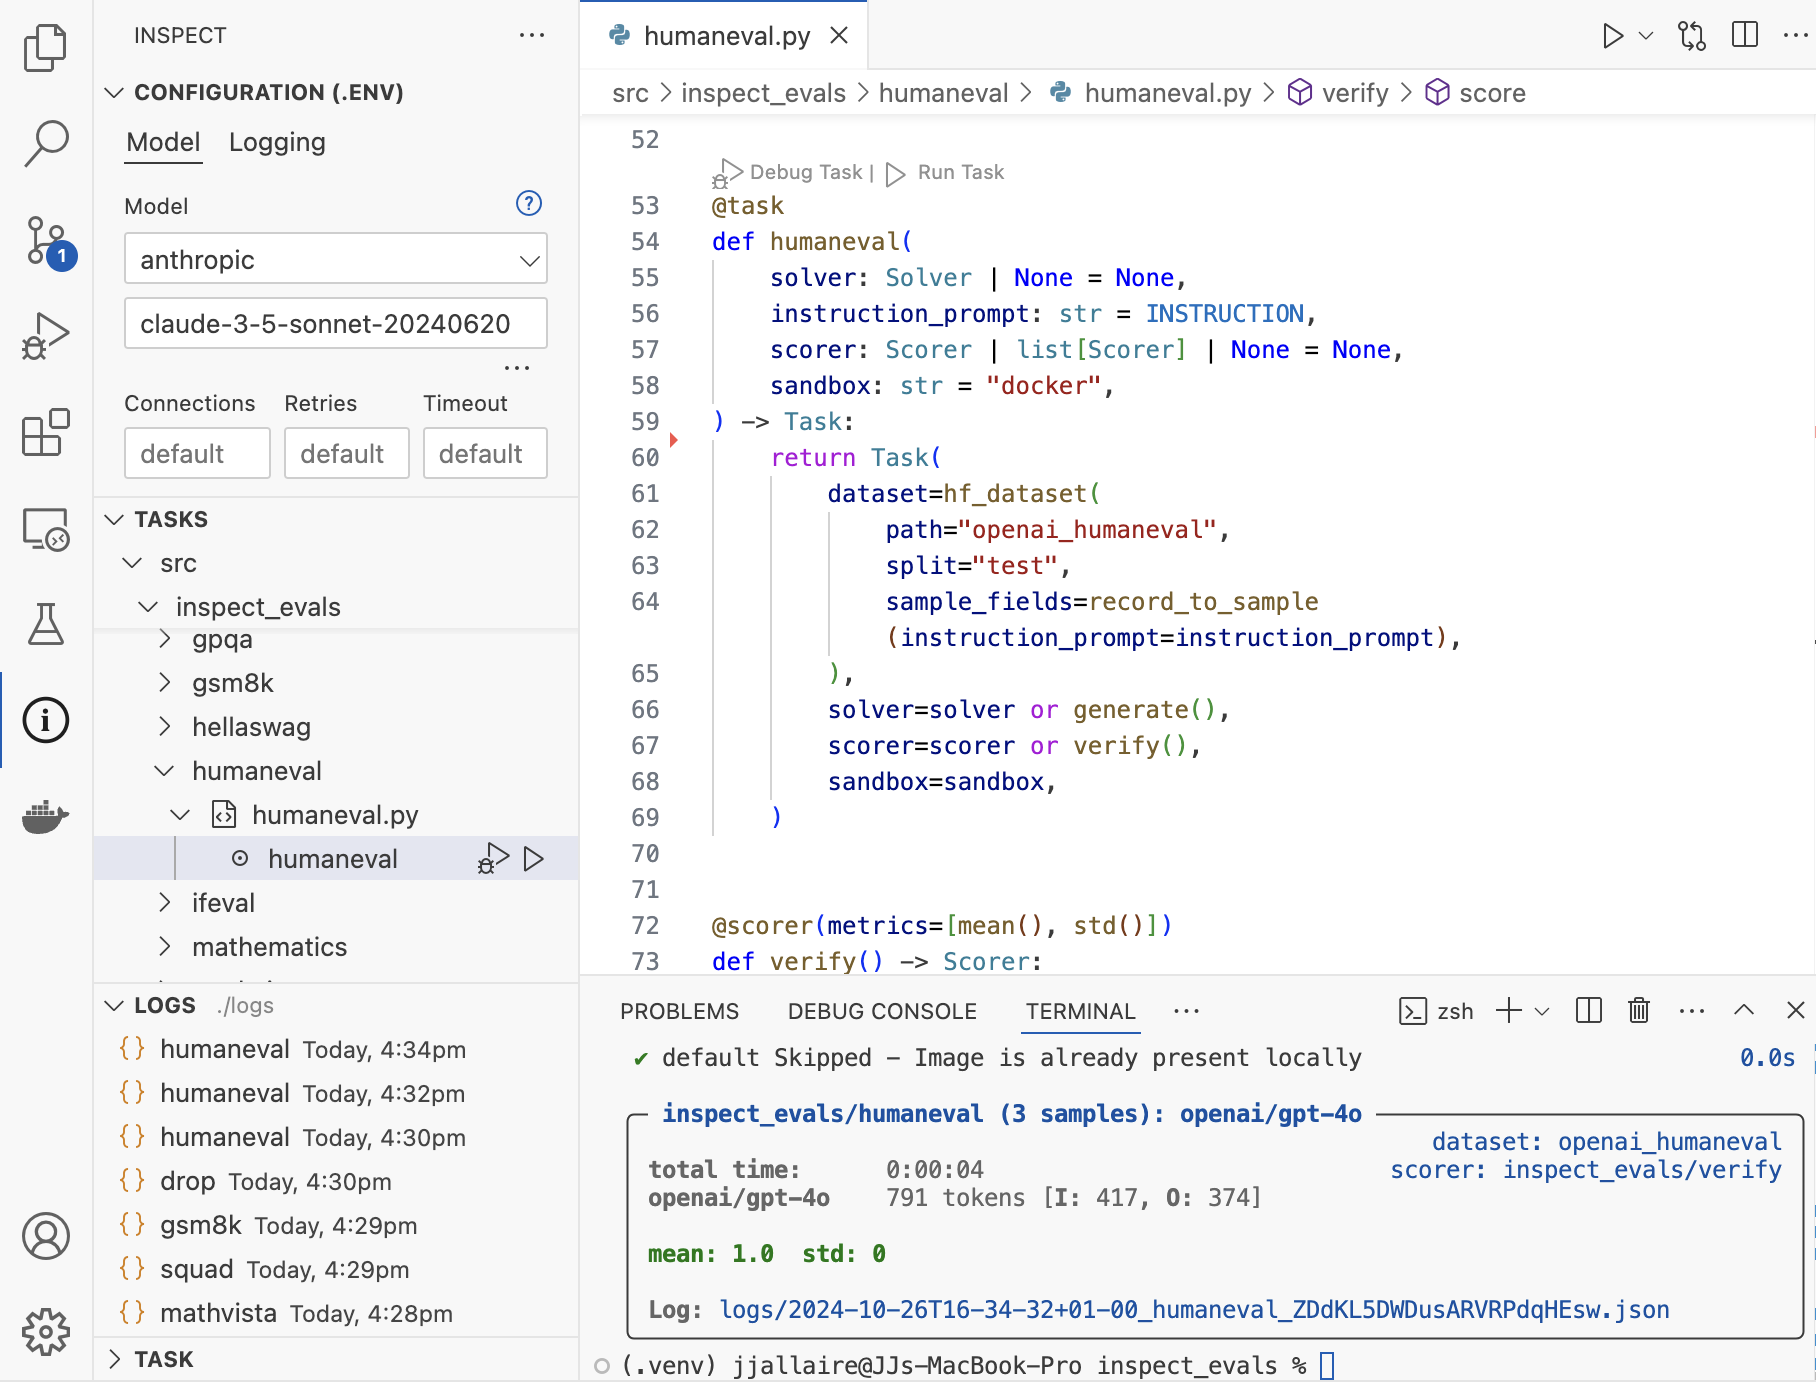
The activity bar has four panels:
Configuration edits global configuration by reading and writing values from the workspace
.envconfig file (see the documentation on Options for more details on.envfiles).Tasks displays all tasks in the current workspace, and can be used to both navigate among tasks as well as run and debug tasks directly.
Logs lists the logs in a local or remote log directory (When you select a log it is displayed in an editor pane using the Inspect log viewer).
Task provides a way to tweak the CLI arguments passed to
inspect evalwhen it is run from the user interface.
Python Environments
When running and debugging Inspect evaluations, the Inspect extension will attempt to use python environments that it discovers in the task subfolder and its parent folders (all the way to the workspace root). It will use the first environment that it discovers, otherwise it will use the python interpreter configured for the workspace. Note that since the extension will use the sub-environments, Inspect must be installed in any of the environments to be used.
You can control this behavior with the Use Subdirectory Environments. If you disable this setting, the globally configured interpreter will always be used when running or debugging evaluations, even when environments are present in subdirectories.
Troubleshooting
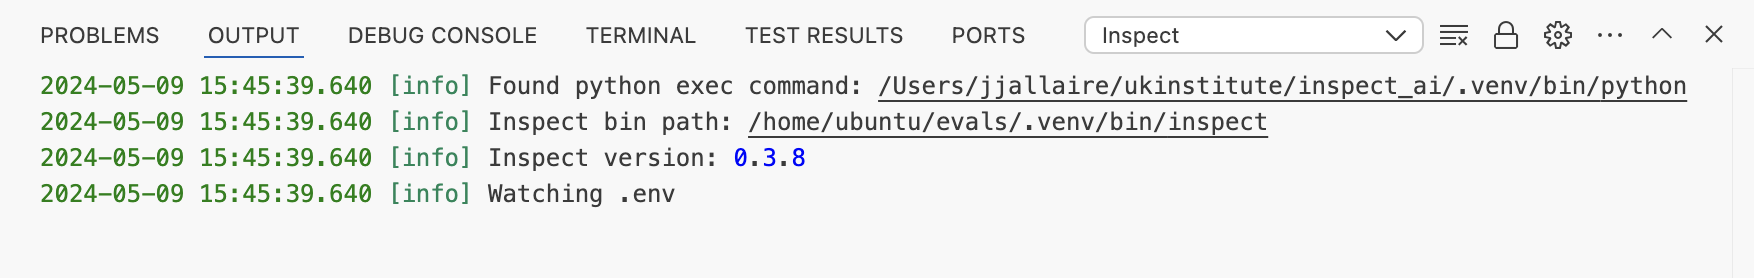
If the Inspect extension is not loading into the workspace, you should investigate what version of Python it is discovering as well as whether the inspect-ai package is detected within that Python environment. Use the Output panel (at the bottom of VS Code in the same panel as the Terminal) and select the Inspect output channel using the picker on the right side of the panel:
Note that the Inspect extension will automatically bind to the Python interpreter associated with the current workspace, so you should be sure that the inspect-ai package is installed within that environment. Use the Python: Select Interpreter command to associate a version of Python with your workspace.